United States
Securities and Exchange Commission
Washington, D.C. 20549
FORM 10-K
(Mark One)
|
x
|
ANNUAL REPORT PURSUANT TO SECTION 13 OR 15(d) OF THE SECURITIES EXCHANGE ACT OF 1934
|
For the fiscal year ended December 31, 2010
OR
|
¨
|
TRANSITION REPORT PURSUANT TO SECTION 13 OR 15(d) OF THE SECURITIES EXCHANGE ACT OF 1934
|
Commission File Number: 001-34382
ROCKY BRANDS, INC.
(Exact name of Registrant as specified in its charter)
|
Ohio
|
No. 31-1364046
|
|
(State or other jurisdiction of
|
(I.R.S. Employer Identification No.)
|
|
incorporation or organization)
|
39 East Canal Street
Nelsonville, Ohio 45764
(Address of principal executive offices, including zip code)
(740) 753-1951
(Registrant's telephone number, including area code)
Securities registered pursuant to Section 12(b) of the Act:
|
Title of each class
|
Name of each exchange on which registered
|
|
Common Shares, without par value
|
The NASDAQ Stock Market, Inc.
|
Securities registered pursuant to Section 12(g) of the Act: None
Indicate by check mark if the registrant is a well-known seasoned issuer (as defined in Rule 405 of the Securities Act). Yes ¨ No x
Indicate by check mark if the registrant is not required to file reports pursuant to Section 13 or Section 15(d) of the Act. Yes ¨ No x
Indicate by checkmark whether the registrant (1) has filed all reports required to be filed by Section 13 or 15(d) of the Securities Exchange Act of 1934 during the preceding 12 months, and (2) has been subject to the filing requirements for at least the past 90 days. YES x NO ¨
Indicate by check mark whether the registrant has submitted electronically and posted on its corporate Web site, if any, every Interactive Data File required to be submitted and posted pursuant to Rule 405 of Regulation S-T (§ 232.405 of this chapter) during the preceding 12 months (or for such shorter period that the registrant was required to submit and post such files). YES o NO ¨
Indicate by check mark if disclosure of delinquent filers pursuant to Item 405 of Regulation S-K is not contained herein, and will not be contained, to the best of Registrant's knowledge, in definitive proxy or information statements incorporated by reference in Part III of this Form 10-K or any amendment to this Form 10-K. ¨
Indicate by check mark whether the registrant is a large accelerated filer, an accelerated filer, or a non-accelerated filer (as defined in Exchange Act Rule 12b-2). (Check one):
Large accelerated filer ¨ Accelerated filer ¨ Non-accelerated filer ¨ Smaller reporting company x
(Do not check if a smaller reporting company)
Indicate by check mark whether the registrant is a shell company (as defined in Rule 12b-2 of the Exchange Act). Yes ¨ No x
The aggregate market value of the Registrant's Common Stock held by non-affiliates of the Registrant was approximately $43,167,952 on June 30, 2010.
There were 7,459,037 shares of the Registrant's Common Stock outstanding on February 22, 2011.
DOCUMENTS INCORPORATED BY REFERENCE
Portions of the Registrant's Proxy Statement for the 2011 Annual Meeting of Shareholders are incorporated by reference in Part III.
TABLE OF CONTENTS
|
Page
|
||
|
PART I
|
||
|
Item 1.
|
Business.
|
3
|
|
Item 1A.
|
Risk Factors.
|
11
|
|
Item 1B.
|
Unresolved Staff Comments.
|
15
|
|
Item 2.
|
Properties.
|
15
|
|
Item 3.
|
Legal Proceedings.
|
16
|
|
Item 4.
|
Reserved.
|
16
|
|
PART II
|
||
|
Item 5.
|
Market for Registrant’s Common Equity, Related Stockholder Matters and Issuer Purchases of Equity Securities.
|
16
|
|
Item 6.
|
Selected Consolidated Financial Data.
|
18
|
|
Item 7.
|
Management's Discussion and Analysis of Financial Condition and Results of Operation.
|
18
|
|
Item 7A.
|
Quantitative and Qualitative Disclosures About Market Risk.
|
30
|
|
Item 8.
|
Financial Statements and Supplementary Data.
|
30
|
|
Item 9.
|
Changes in and Disagreements With Accountants on Accounting and Financial Disclosure.
|
30
|
|
Item 9A.
|
Controls and Procedures.
|
31
|
|
Item 9B.
|
Other Information.
|
33
|
|
PART III
|
||
|
Item 10.
|
Directors, Executive Officers and Corporate Governance.
|
33
|
|
Item 11.
|
Executive Compensation.
|
33
|
|
Item 12.
|
Security Ownership of Certain Beneficial Owners and Management and Related Shareholder Matters.
|
33
|
|
Item 13.
|
Certain Relationships and Related Transactions, and Director Independence.
|
33
|
|
Item 14.
|
Principal Accounting Fees and Services.
|
33
|
|
PART IV
|
||
|
Item 15.
|
Exhibits and Financial Statement Schedules.
|
34
|
|
SIGNATURES
|
38
|
|
2
This Annual Report on Form 10-K contains forward-looking statements within the meaning of Section 21E of the Securities Exchange Act of 1934, as amended, and Section 27A of the Securities Act of 1933, as amended. The words “anticipate,” “believe,” “expect,” “estimate,” and “project” and similar words and expressions identify forward-looking statements which speak only as of the date hereof. Investors are cautioned that such statements involve risks and uncertainties that could cause actual results to differ materially from historical or anticipated results due to many factors, including, but not limited to, the
factors discussed in “Item 1A, Risk Factors.” The Company undertakes no obligation to publicly update or revise any forward-looking statements.
PART I
|
ITEM 1.
|
BUSINESS.
|
All references to “we,” “us,” “our,” “Rocky Brands,” or the “Company” in this Annual Report on Form 10-K mean Rocky Brands, Inc. and our subsidiaries.
We are a leading designer, manufacturer and marketer of premium quality footwear and apparel marketed under a portfolio of well recognized brand names including Rocky, Georgia Boot, Durango, Lehigh, and the licensed brands Mossy Oak and Michelin. Our brands have a long history of representing high quality, comfortable, functional and durable footwear and our products are organized around four target markets: outdoor, work, duty and western. Our footwear products incorporate varying features and are positioned across a range of suggested retail price points from $29.95 for our value priced products to $314.99 for our premium products. In addition, as part of our strategy of outfitting
consumers from head-to-toe, we market complementary branded apparel and accessories that we believe leverage the strength and positioning of each of our brands.
Our products are distributed through three distinct business segments: wholesale, retail and military. In our wholesale business, we distribute our products through a wide range of distribution channels representing over 10,000 retail store locations in the U.S. and Canada. Our wholesale channels vary by product line and include sporting goods stores, outdoor retailers, independent shoe retailers, hardware stores, catalogs, mass merchants, uniform stores, farm store chains, specialty safety stores and other specialty retailers. Our retail business includes direct sales of our products to consumers through our Lehigh Outfitters mobile and retail stores (including a fleet of trucks,
supported by small warehouses that include retail stores, which we refer to as mini-stores), our Rocky outlet store and our websites. We also sell footwear under the Rocky label to the U.S. military.
Competitive Strengths
Our competitive strengths include:
|
|
•
|
Strong portfolio of brands. We believe the Rocky, Georgia Boot, Durango, Lehigh, Mossy Oak and Michelin brands are well recognized and established names that have a reputation for performance, quality and comfort in the markets they serve: outdoor, work, duty and western. We plan to continue strengthening these brands through product innovation in existing footwear markets, by extending certain of these brands into our other target markets and by introducing complementary apparel and accessories under our owned brands.
|
|
|
•
|
Commitment to product innovation. We believe a critical component of our success in the marketplace has been a result of our continued commitment to product innovation. Our consumers demand high quality, durable products that incorporate the highest level of comfort and the most advanced technical features and designs. We have a dedicated group of product design and development professionals, including well recognized experts in the footwear and apparel industries, who continually interact with consumers to better understand their needs and are committed to ensuring our products reflect the most advanced designs, features and materials available in the marketplace.
|
|
|
•
|
Long-term retailer relationships. We believe that our long history of designing, manufacturing and marketing premium quality, branded footwear has enabled us to develop strong relationships with our retailers in each of our distribution channels. We reinforce these relationships by continuing to offer innovative footwear products, by continuing to meet the individual needs of each of our retailers and by working with our retailers to improve the visual merchandising of our products in their stores. We believe that strengthening our relationships with retailers will allow us to increase our presence through additional store locations and expanded shelf space, improve our market position in a consolidating
retail environment and enable us to better understand and meet the evolving needs of both our retailers and consumers.
|
3
|
|
•
|
Diverse product sourcing and manufacturing capabilities. We believe our strategy, of utilizing both company operated and third-party facilities for the sourcing of our products, offers several advantages. Operating our own facilities significantly improves our knowledge of the entire production process, which allows us to more efficiently source product from third parties that is of the highest quality and at the lowest cost available. We intend to continue to source a higher proportion of our products from third-party manufacturers, which we believe will enable us to obtain high quality products at lower costs per unit.
|
Growth Strategy
We intend to increase our sales through the following strategies:
|
|
•
|
Expand into new target markets under existing brands. We believe there is significant opportunity to extend certain of our brands into our other target markets. We intend to continue to introduce products across varying feature sets and price points in order to meet the needs of our retailers.
|
|
|
•
|
Cross-sell our brands to our retailers. We believe that many retailers of our existing and acquired brands target consumers with similar characteristics and, as a result, we believe there is significant opportunity to offer each of our retailers a broader assortment of footwear and apparel that target multiple markets and span a range of feature sets and price points.
|
|
|
•
|
Expand Business Internationally. We intend to extend certain of our brands into international markets. We believe this is a significant opportunity because of the long history and authentic heritage of these brands. We intend on growing our business internationally through a network of distributors.
|
|
|
•
|
Increase apparel offerings. We believe the long history and authentic heritage of our owned brands provide significant opportunity to extend each of these brands into complementary apparel. We intend to continue to increase our Rocky apparel offerings and believe that similar opportunities exist for our Georgia Boot and Durango brands in their respective markets.
|
|
|
•
|
Acquire or develop new brands. We intend to continue to acquire or develop new brands that are complementary to our portfolio and could leverage our operational infrastructure and distribution network.
|
Product Lines
Our product lines consist of high quality products that target the following markets:
|
|
•
|
Outdoor. Our outdoor product lines consist of footwear, apparel and accessory items marketed to outdoor enthusiasts who spend time actively engaged in activities such as hunting, fishing, camping or hiking. Our consumers demand high quality, durable products that incorporate the highest level of comfort and the most advanced technical features, and we are committed to ensuring our products reflect the most advanced designs, features and materials available in the marketplace. Our outdoor product lines consist of all-season sport/hunting footwear, apparel and accessories that are typically waterproof and insulated and are designed to keep outdoorsmen comfortable on rugged terrain or in extreme weather
conditions.
|
|
|
•
|
Work. Our work product lines consist of footwear and apparel marketed to industrial and construction workers, as well as workers in the hospitality industry, such as restaurants or hotels. All of our work products are specially designed to be comfortable, incorporate safety features for specific work environments or tasks and meet applicable federal and other standards for safety. This category includes products such as safety toe footwear for steel workers and non-slip footwear for kitchen workers.
|
|
|
•
|
Duty. Our duty product line consists of footwear products marketed to law enforcement, security personnel and postal employees who are required to spend a majority of time at work on their feet. All of our duty footwear styles are designed to be comfortable, flexible, lightweight, slip resistant and durable. Duty footwear is generally designed to fit as part of a uniform and typically incorporates stylistic features, such as black leather uppers in addition to the comfort features that are incorporated in all of our footwear products.
|
|
|
•
|
Western. Our western product line currently consists of authentic footwear products marketed to farmers and ranchers who generally live in rural communities in North America. We also selectively market our western footwear to consumers enamored with the western lifestyle.
|
Our products are marketed under four well-recognized, proprietary brands, Rocky, Georgia Boot, Durango and Lehigh, in addition to the licensed brands of Michelin and Mossy Oak.
4
Rocky
Rocky, established in 1979, is our premium priced line of branded footwear, apparel and accessories. We currently design Rocky products for each of our four target markets and offer our products at a range of suggested retail price points: $99.95 to $314.95 for our footwear products, $29.95 to $49.95 for tops and bottoms in our apparel lines and $49.95 to $199.95 for our basic and technical outerwear.
The Rocky brand originally targeted outdoor enthusiasts, particularly hunters, and has since become the market leader in the hunting boot category. In 2002, we also extended into hunting apparel, including jackets, pants, gloves and caps. Our Rocky products for hunters and other outdoor enthusiasts are designed for specific weather conditions and the diverse terrains of North America. These products incorporate a range of technical features and designs such as Gore-Tex waterproof breathable fabric, 3M Thinsulate insulation, nylon Cordura fabric and camouflaged uppers featuring either Mossy Oak or Realtree patterns. Rugged outsoles made by industry leaders like Vibram are sometimes
used in conjunction with our proprietary design features like the “Rocky Ride Comfort System” to make the products durable and easy to wear.
We also produce Rocky duty footwear targeting law enforcement professionals, military, security workers and postal service employees, and we believe we have established a leading market share position in this category.
In 2002, we introduced Rocky work footwear designed for varying weather conditions or difficult terrain, particularly for people who make their living outdoors such as those in lumber or forestry occupations. These products typically include many of the proprietary features and technologies that we incorporate in our hunting and outdoor products. Similar to our strategy for the outdoor market, we introduced rugged work apparel in 2004, such as ranch jackets and carpenter jeans.
We have also introduced western influenced work boots for farmers and ranchers. Most of these products are waterproof, insulated and utilize our proprietary comfort systems. We also recently introduced some men’s and women’s casual western footwear for consumers enamored with western influenced fashion.
Georgia Boot
Georgia Boot was launched in 1937 and is our moderately priced, high quality line of work footwear. Georgia Boot footwear is sold at suggested retail price points ranging from $79.95 to $109.95. This line of products primarily targets construction workers and those who work in industrial plants where special safety features are required for hazardous work environments. Many of our boots incorporate steel toes or metatarsal guards to protect wearers’ feet from heavy objects and non-slip outsoles to prevent slip related injuries in the work place. All of our boots are designed to help prevent injury and subsequent work loss and are designed according to standards
determined by the Occupational Safety & Health Administration or other standards required by employers.
In addition, we market a line of Georgia Boot footwear to brand loyal consumers for hunting and other outdoor activities. These products are primarily all leather boots distributed in the western and southwestern states where hunters do not require camouflaged boots or other technical features incorporated in our Rocky footwear.
We believe the Georgia Boot brand can be extended into moderately priced duty footwear as well as outdoor and work apparel.
Durango
Durango is our moderately priced, high quality line of western footwear. Launched in 1965, the brand has developed broad appeal and earned a reputation for authenticity and quality in the western footwear market. Our current line of products is offered at suggested retail price points ranging from $79.95 to $149.95, and we market products designed for both work and casual wear. Our Durango line of products primarily targets farm and ranch workers who live in the heartland where western influenced footwear and apparel is worn for work and casual wear and, to a lesser extent, this line appeals to urban consumers enamored with western influenced fashion. Many of our western
boots marketed to farm and ranch workers are designed to be durable, including special “barn yard acid resistant” leathers to maintain integrity of the uppers, and incorporate our proprietary “Comfort Core” system to increase ease of wear and reduce foot fatigue. Other products in the Durango line that target casual and fashion oriented consumers have colorful leather uppers and shafts with ornate stitch patterns and are offered for men, women and children.
5
Lehigh
The Lehigh brand was launched in 1922 and is our moderately priced, high quality line of safety shoes sold at suggested retail price points ranging from $29.95 to $149.95. Our current line of products is designed to meet occupational safety footwear needs. Most of this footwear incorporates steel toes to protect workers and often incorporates other safety features such as metatarsal guards or non-slip outsoles. Additionally, certain models incorporate durability features to combat abrasive surfaces or caustic substances often found in some work places.
With the recent shift in manufacturing jobs to service jobs in the U.S., Lehigh began marketing products for the hospitality industry. These products have non-slip outsoles designed to reduce slips, trips and falls in kitchen environments where floors are often tiled and greasy. Price points for this kind of footwear range from $29.95 to $49.95.
Michelin
Michelin is a premier price point line of work footwear targeting specific industrial professions, primarily indoor professions. The license to design, develop and manufacture footwear under the Michelin name was secured in 2006. Suggested retail prices for the Michelin brand are from $99.95 to $159.95. The license agreement for the Michelin brand expires on December 31, 2012.
Mossy Oak
Mossy Oak is high quality, value priced line of casual and hunting footwear. The license to design, develop and manufacture footwear under the Mossy Oak name was secured in 2008. Suggested retail prices for the Mossy Oak Brand are from $39.95 to $79.95 for casual footwear and $49.95 to 89.95 for hunting footwear.
Dickies
Our licensing agreement for the Dickies brand expired on December 31, 2010. Sales of our Dickies branded merchandise approximated $7.6 million in 2010. Per our agreement with Dickies, they purchased some of the remaining inventory and we have the right to sell the remaining inventory through June 30, 2011.
Sales and Distribution
Our products are distributed through three distinct business segments: wholesale, retail and military. You can find more information regarding our three business segments in Note 14 to our consolidated financial statements.
Wholesale
In the U.S., we distribute Rocky, Georgia Boot, Durango, Michelin, and Mossy Oak products through a wide range of wholesale distribution channels. As of December 31, 2010, our products were offered for sale at over 10,000 retail locations in the U.S. and Canada.
We sell our products to wholesale accounts in the U.S. primarily through a dedicated in-house sales team who carry our branded products exclusively, as well as independent sales representatives who carry our branded products and other non-competing products. Our sales force for Rocky is organized around major accounts, including Bass Pro Shops, Cabela’s, Dick’s Sporting Goods and Gander Mountain, and around our target markets: outdoor, work, duty and western. For our Georgia Boot and Durango brands, our sales employees are organized around each brand and target a broad range of distribution channels. All of our sales people actively call on their retail customer base to
educate them on the quality, comfort, technical features and breadth of our product lines and to ensure that our products are displayed effectively at retail locations.
Our wholesale distribution channels vary by market:
|
|
•
|
Our outdoor products are sold primarily through sporting goods stores, outdoor specialty stores, catalogs and mass merchants.
|
|
|
•
|
Our work-related products are sold primarily through retail uniform stores, catalogs, farm store chains, specialty safety stores, independent shoe stores and hardware stores.
|
6
|
|
•
|
Our duty products are sold primarily through uniform stores and catalog specialists.
|
|
|
•
|
Our western products are sold through western stores, work specialty stores, specialty farm and ranch stores and more recently, fashion oriented footwear retailers.
|
Retail
We market products directly to consumers through three retail strategies: mobile and retail stores, our outlet store and our websites.
Mobile and Retail Stores
Lehigh markets branded work footwear, principally through mobile stores, to industrial and hospitality related corporate customers across the U.S. We work closely with our customers to select footwear products best suited for the specific safety needs of their work site and that meet the standards determined by the Occupational Safety & Health Administration or other standards required by our customers. Our customers include large, national companies such as 3M, Abbott Laboratories, Alcoa, Carnival Cruise Lines, Federal Express, IBM and Texas Instruments.
Our Lehigh mobile stores are stocked with work footwear, as established by the specific needs of our customers, and typically include our owned brands augmented by branded work footwear from third parties including Dunham and Timberland Pro. Prior to a scheduled site visit, Lehigh sales managers consult with our corporate customers to ensure that our trucks are appropriately stocked for their specific needs. Our trucks then perform a site visit where customer employees select work related footwear and apparel. Our corporate customers generally purchase footwear or provide payroll deduction plans for footwear purchases by their employees. We believe that our ability to service work
sites across the U.S. allows us to effectively compete for large, national customers who have employees located throughout the U.S.
Lehigh continues to focus on converting our customers from delivery via our mobile stores to purchasing via the Internet and delivery direct to the consumer via a freight carrier. This is our lowest cost safety shoe solution for our customers and our most profitable.
Outlet Store
We operate the Rocky outlet store in Nelsonville, Ohio. Our outlet store primarily sells first quality or discontinued products in addition to a limited amount of factory damaged goods. Related products from other manufacturers are also sold in the store. Our outlet store allows us to showcase the breadth of our product lines as well as to cost-effectively sell slow-moving inventory. Our outlet store also provides an opportunity to interact with consumers to better understand their needs.
Websites
We sell our product lines on our websites at www.rockyboots.com, www.georgiaboot.com, www.lehighoutfitters.com, www.lehighsafetyshoes.com, www.slipgrips.com and www.dickiesfootwear.com. We believe that our internet presence allows us to showcase the breadth and depth of our product lines in each of our target markets and enables us to educate our consumers about the
unique technical features of our products.
Military
While we are focused on continuing to build our wholesale and retail business, we also actively bid on footwear contracts with the U.S. military, which requires products to be made in the U.S. Our manufacturing facilities in Puerto Rico, a U.S. territory, allow us to competitively bid for such contracts. In July 2007, we were awarded a $6.4 million order to produce footwear for the U.S. military, which includes an option for four yearly renewals at similar amounts. In January 2008, we were awarded a $5.0 million order to produce footwear for the U.S. Military, which includes an option for four yearly renewals at similar amounts. In July 2009, we were awarded a $29.0 million
blanket purchase order from the GSA to produce footwear for the U.S. Military through 2014.
All of our footwear for the U.S. military is currently branded Rocky. We believe that many U.S. service men and women are active outdoor enthusiasts and may be employed in many of the work and duty markets that we target with our brands. As a result, we believe our sales to the U.S. military serve as an opportunity to reach our target demographic with high quality branded products.
7
Marketing and Advertising
We believe that our brands have a reputation for high quality, comfort, functionality and durability built through their long history in the markets they serve. To further increase the strength and awareness of our brands, we have developed comprehensive marketing and advertising programs to gain national exposure and expand brand awareness for each of our brands in their target markets.
We have focused the majority of our advertising efforts on consumers in support of our retail partners. A key component of this strategy includes in-store point of purchase materials that add a dramatic focus to our brands and the products our retail partners carry. We also advertise through targeted national and local cable programs and print publications aimed at audiences that share the demographic profile of our typical customers. For example, we are a main sponsor of the hit outdoor TV shows, “Archer’s Choice” and “the Choice” featuring hosts Ralph and Vicki Cianciarulo; Mossy Oak’s “Hunting the Country” on The Outdoor
Channel; as well as “Obsession Revealed” and “Turkey Thugs” on the Pursuit Network. In addition we advertise in such print publications as Outdoor Life and North American Hunter and on targeted cable broadcasts for NASCAR and NHRA on The Outdoor Channel and Versus television networks. We also promote our products through event sponsorships. We are a sponsor of the Kevin Harvick NASCAR racing team and the Kallita MotoSports NHRA racing team. These events are broadcasted on the ESPN and FOX television networks. These sponsorship properties provide significant national exposure for all of our brands, as well as direct connection to our target customers. Our print advertisements and radio and television commercials emphasize the technical features of our products as well as their high quality, comfort,
functionality and durability.
We also support independent dealers by listing their locations in our national print advertisements. In addition to our national advertising campaign, we have developed attractive merchandising displays and store-in-store concept fixturing that are available to our retailers who purchase the breadth of our product lines. We also attend numerous tradeshows, including the World Shoe Association show, the Denver International Western Retailer Market and the Shooting, Hunting, Outdoor Exposition. Tradeshows allow us to showcase our entire product line to retail buyers and have historically been an important source of new accounts.
Product Design and Development
We believe that product innovation is a key competitive advantage for us in each of our markets. Our goal in product design and development is to continue to create and introduce new and innovative footwear and apparel products that combine our standards of quality, functionality and comfort and that meet the changing needs of our retailers and consumers. Our product design and development process is highly collaborative and is typically initiated both internally by our development staff and externally by our retailers and suppliers, whose employees are generally active users of our products and understand the needs of our consumers. Our product design and development personnel,
marketing personnel and sales representatives work closely together to identify opportunities for new styles, camouflage patterns, design improvements and newer, more advanced materials. We have a dedicated group of product design and development professionals, some of whom are well recognized experts in the footwear and apparel industries, who continually interact with consumers to better understand their needs and are committed to ensuring our products reflect the most advanced designs, features and materials available in the marketplace.
Manufacturing and Sourcing
We manufacture footwear in facilities that we operate in the Dominican Republic and Puerto Rico, and source footwear, apparel and accessories from third-party facilities, primarily in China. We do not have long-term contracts with any of our third-party manufacturers. The products purchased from General Shoes US Corporation and its subsidiaries, one of our third-party manufacturers in China with whom we have had a relationship for over 20 years and which has historically accounted for a significant portion of our manufacturing, represented approximately 20% of our net sales in 2010. We believe that operating our own facilities significantly improves our knowledge of the entire raw
material sourcing and manufacturing process enabling us to more efficiently source finished goods from third parties that are of the highest quality and at the lowest cost available. In addition, our Puerto Rican facilities allow us to produce footwear for the U.S. military and other commercial businesses that require production by a U.S. manufacturer. Sourcing products from offshore third-party facilities generally enables us to lower our costs per unit while maintaining high product quality and it limits the capital investment required to establish and maintain company operated manufacturing facilities. Because quality is an important part of our value proposition to our retailers and consumers, we source products from manufacturers who have demonstrated the intent and ability to maintain the high quality that has become associated with our
brands.
8
Quality control is stressed at every stage of the manufacturing process and is monitored by trained quality assurance personnel at each of our manufacturing facilities, including our third-party factories. In addition, we utilize a team of procurement, quality control and logistics employees in our China office to visit factories to conduct quality control reviews of raw materials, work in process inventory and finished goods. We also utilize quality control personnel at our finished goods distribution facilities to conduct quality control testing on incoming sourced finished goods and raw materials and inspect random samples from our finished goods inventory from each of our manufacturing
facilities to ensure that all items meet our high quality standards.
Our products are primarily distributed in the United States, Canada, South America, Europe and Asia. We ship our products from our finished goods distribution facilities located in Logan, Ohio and Waterloo, Ontario, Canada. Certain of our retailers receive shipments directly from our manufacturing sources, including all of our U.S. military sales, which are shipped directly from our manufacturing facilities in Puerto Rico.
Suppliers
We purchase raw materials from sources worldwide. We do not have any long-term supply contracts for the purchase of our raw materials, except for limited blanket orders on leather to protect wholesale selling prices for an extended period of time. The principal raw materials used in the production of our products, in terms of dollar value, are leather, Gore-Tex waterproof breathable fabric, Cordura nylon fabric and soling materials. We believe these materials will continue to be available from our current suppliers. However, in the event these materials are not available from our current suppliers, we believe these products, or similar products, would be available from
alternative sources.
Seasonality and Weather
Historically, we have experienced significant seasonal fluctuations in our business because we derive a significant portion of our revenues from sales of our outdoor products. Many of our outdoor products are used by consumers in cold or wet weather. As a result, a majority of orders for these products are placed by our retailers in January through April for delivery in July through October. In order to meet demand, we must manufacture and source outdoor footwear year round to be in a position to ship advance orders for these products during the last two quarters of each year. Accordingly, average inventory levels have been highest during the second and third quarters of each year and sales have been highest in the
last two quarters of each year. In addition, mild or dry weather conditions historically have had a material adverse effect on sales of our outdoor products, particularly if they occurred in broad geographical areas during late fall or early winter. Since 2005, we have experienced and we expect that we will continue to experience less seasonality and that our business will be subject to reduced weather risk because we now derive a higher proportion of our sales from work-related footwear products. Generally, work, duty and western footwear is sold year round and is not subject to the same level of seasonality or variation in weather as our outdoor product lines. However, because of seasonal fluctuations and variations in weather conditions from year to year, there is no assurance that the results for any particular interim period will be indicative of results for the full year or for
future interim periods.
Backlog
At December 31, 2010, our backlog was $11.3 million compared to $23.2 million at December 31, 2009. Our backlog at December 31, 2010 includes no outstanding orders under contracts with the U.S. Military versus $11.6 at December 31, 2009. Because a substantial portion of our orders are placed by our retailers in January through April for delivery in July through October, our backlog is lowest during the October through December period and peaks during the April through June period. Factors other than seasonality could have a significant impact on our backlog and, therefore, our backlog at any one point in time may not be indicative of future results. Generally, orders may be
canceled by retailers prior to shipment without penalty.
Patents, Trademarks and Trade Names
We own numerous design and utility patents for footwear, footwear components (such as insoles and outsoles) and outdoor apparel in the U.S. and in foreign countries including Canada, Mexico, China and Taiwan. We own U.S. and certain foreign registrations for the trademarks used in our business, including our marks Rocky, Georgia Boot, Durango and Lehigh. In addition, we license trademarks, including Gore-Tex, Mossy Oak and Michelin, in order to market our products. Our license to manufacture and distribute products bearing the Dickies brand terminated on December 31, 2010.
9
Our license with W. L. Gore & Associates, Inc. permits us to use the Gore-Tex and related marks on products and styles that have been approved in advance by Gore. The license agreement may be terminated by either party upon advance written notice to the other party by October 1 for termination effective December 31 of that same year.
Our license with Mossy Oak permits us to use certain marks and patterns owned by Mossy Oak on our products. The initial term of the license agreement is for two years ending in May 2011, and the term automatically renews for one-year periods. The license agreement may be terminated by either party upon ninety days written notice to the other party.
Our license with Gear Six Technologies LLC permits us to use the Michelin and related marks on our products. The license agreement with Gear Six will terminate on December 31, 2012.
In the U.S., our patents are generally in effect for up to 20 years from the date of the filing of the patent application. Our trademarks are generally valid as long as they are in use and their registrations are properly maintained and have not been found to become generic. Trademarks registered outside of the U.S. generally have a duration of 10 years depending on the jurisdiction and are also generally subject to an indefinite number of renewals for a like period upon appropriate application.
While we have an active program to protect our intellectual property by filing for patents and trademarks, we do not believe that our overall business is materially dependent on any individual patent or trademark. We are not aware of any infringement of our intellectual property rights or that we are infringing any intellectual property rights owned by third parties. Moreover, we are not aware of any material conflicts concerning our trademarks or our use of trademarks owned by others.
Competition
We operate in a very competitive environment. Product function, design, comfort, quality, technological and material improvements, brand awareness, timeliness of product delivery and pricing are all important elements of competition in the markets for our products. We believe that the strength of our brands, the quality of our products and our long-term relationships with a broad range of retailers allows us to compete effectively in the footwear and apparel markets that we serve. However, we compete with footwear and apparel companies that have greater financial, marketing, distribution and manufacturing resources than we do. In addition, many of these competitors have
strong brand name recognition in the markets they serve.
The footwear and apparel industry is also subject to rapid changes in consumer preferences. Some of our product lines are susceptible to changes in both technical innovation and fashion trends. Therefore, the success of these products and styles are more dependent on our ability to anticipate and respond to changing product, material and design innovations as well as fashion trends and consumer demands in a timely manner. Our inability or failure to do so could adversely affect consumer acceptance of these product lines and styles and could have a material adverse effect on our business, financial condition and results of operations.
Employees
At December 31, 2010, we had approximately 2,450 employees of which approximately 2,290 are full time employees. Approximately 1,875 of our employees work in our manufacturing facilities in the Dominican Republic and Puerto Rico. None of our employees are represented by a union. We believe our relations with our employees are good.
Available Information
We make available free of charge on our corporate website, www.rockybrands.com, our annual report on Form 10-K, quarterly reports on Form 10-Q, current reports on Form 8-K and, if applicable, amendments to those reports filed or furnished pursuant to Section 13(a) or 15(d) of the Securities Exchange Act of 1934, as amended, as soon as reasonably practicable after such reports are electronically filed with or furnished to the Securities and Exchange Commission.
10
|
ITEM 1A.
|
RISK FACTORS.
|
Business Risks
Expanding our brands into new footwear and apparel markets may be difficult and expensive, and if we are unable to successfully continue such expansion, our brands may be adversely affected, and we may not achieve our planned sales growth.
Our growth strategy is founded substantially on the expansion of our brands into new footwear and apparel markets. New products that we introduce may not be successful with consumers or one or more of our brands may fall out of favor with consumers. If we are unable to anticipate, identify or react appropriately to changes in consumer preferences, we may not grow as fast as we plan to grow or our sales may decline, and our brand image and operating performance may suffer.
Furthermore, achieving market acceptance for new products will likely require us to exert substantial product development and marketing efforts, which could result in a material increase in our selling, general and administrative, or SG&A, expenses, and there can be no assurance that we will have the resources necessary to undertake such efforts. Material increases in our SG&A expenses could adversely impact our results of operations and cash flows.
We may also encounter difficulties in producing new products that we did not anticipate during the development stage. Our development schedules for new products are difficult to predict and are subject to change as a result of shifting priorities in response to consumer preferences and competing products. If we are not able to efficiently manufacture newly-developed products in quantities sufficient to support retail distribution, we may not be able to recoup our investment in the development of new products. Failure to gain market acceptance for new products that we introduce could impede our growth, reduce our profits, adversely affect the image of our brands, erode our competitive
position and result in long term harm to our business.
A majority of our products are produced outside the U.S. where we are subject to the risks of international commerce.
A majority of our products are produced in the Dominican Republic and China. Therefore, our business is subject to the following risks of doing business offshore:
|
|
•
|
the imposition of additional United States legislation and regulations relating to imports, including quotas, duties, taxes or other charges or restrictions;
|
|
|
•
|
foreign governmental regulation and taxation;
|
|
|
•
|
fluctuations in foreign exchange rates;
|
|
|
•
|
changes in economic conditions;
|
|
|
•
|
transportation conditions and costs in the Pacific and Caribbean;
|
|
|
•
|
changes in the political stability of these countries; and
|
|
|
•
|
changes in relationships between the United States and these countries.
|
If any of these factors were to render the conduct of business in these countries undesirable or impracticable, we would have to manufacture or source our products elsewhere. There can be no assurance that additional sources or products would be available to us or, if available, that these sources could be relied on to provide product at terms favorable to us. The occurrence of any of these developments would have a material adverse effect on our business, financial condition, results of operations and cash flows.
Our success depends on our ability to anticipate consumer trends.
Demand for our products may be adversely affected by changing consumer trends. Our future success will depend upon our ability to anticipate and respond to changing consumer preferences and technical design or material developments in a timely manner. The failure to adequately anticipate or respond to these changes could have a material adverse effect on our business, financial condition, results of operations and cash flows.
11
Loss of services of our key personnel could adversely affect our business.
The development of our business has been, and will continue to be, highly dependent upon Mike Brooks, Chairman and Chief Executive Officer, David Sharp, President and Chief Operating Officer, and James E. McDonald, Executive Vice President, Chief Financial Officer and Treasurer. Messrs. Brooks, Sharp, and McDonald each have an at-will employment agreement with us. Each employment agreement provides that in the event of termination of employment, without cause, the terminated executive will receive a severance benefit. In the event of termination for any reason, the terminated executive may not compete with us for a period of one year. None of our other executive officers and key
employees has an employment agreement with our company. The loss of the services of any of these officers could have a material adverse effect on our business, financial condition, results of operations and cash flows.
We depend on a limited number of suppliers for key production materials, and any disruption in the supply of such materials could interrupt product manufacturing and increase product costs.
We purchase raw materials from a number of domestic and foreign sources. We do not have any long-term supply contracts for the purchase of our raw materials, except for limited blanket orders on leather. The principal raw materials used in the production of our footwear, in terms of dollar value, are leather, Gore-Tex waterproof breathable fabric, Cordura nylon fabric and soling materials. Availability or change in the prices of our raw materials could have a material adverse effect on our business, financial condition, results of operations and cash flows.
We currently have a licensing agreement for the use of Gore-Tex waterproof breathable fabric, and any termination of this licensing agreement could impact our sales of waterproof products.
We are currently one of the largest customers of Gore-Tex waterproof breathable fabric for use in footwear. Our licensing agreement with W.L. Gore & Associates, Inc. may be terminated by either party upon advance written notice to the other party by October 1 for termination effective December 31 of that same year. Although other waterproofing techniques and materials are available, we place a high value on our Gore-Tex waterproof breathable fabric license because Gore-Tex has high brand name recognition with our customers. The loss of our license to use Gore-Tex waterproof breathable fabric could have a material adverse effect on our competitive position, which could have a
material adverse effect on our business, financial condition, results of operations and cash flows.
Our outdoor products are seasonal.
We have historically experienced significant seasonal fluctuations in our business because we derive a significant portion of our revenues from sales of our outdoor products. Many of our outdoor products are used by consumers in cold or wet weather. As a result, a majority of orders for these products are placed by our retailers in January through April for delivery in July through October. In order to meet demand, we must manufacture and source outdoor footwear year round to be in a position to ship advance orders for these products during the last two quarters of each year. Accordingly, average inventory levels have been highest during the second and third quarters of
each year and sales have been highest in the last two quarters of each year. There is no assurance that we will have either sufficient inventory to satisfy demand in any particular quarter or have sufficient demand to sell substantially all, of our, inventory without significant markdowns.
Our outdoor products are sensitive to weather conditions.
Historically, our outdoor products have been used primarily in cold or wet weather. Mild or dry weather has in the past and may in the future have a material adverse effect on sales of our products, particularly if mild or dry weather conditions occur in broad geographical areas during late fall or early winter. Also, due to variations in weather conditions from year to year, results for any single quarter or year may not be indicative of results for any future period.
12
Our business could suffer if our third-party manufacturers violate labor laws or fail to conform to generally accepted ethical standards.
We require our third-party manufacturers to meet our standards for working conditions and other matters before we are willing to place business with them. As a result, we may not always obtain the lowest cost production. Moreover, we do not control our third-party manufacturers or their respective labor practices. If one of our third-party manufacturers violates generally accepted labor standards by, for example, using forced or indentured labor or child labor, failing to pay compensation in accordance with local law, failing to operate its factories in compliance with local safety regulations or diverging from other labor practices generally accepted as ethical, we likely would cease
dealing with that manufacturer, and we could suffer an interruption in our product supply. In addition, such a manufacturer’s actions could result in negative publicity and may damage our reputation and the value of our brand and discourage retail customers and consumers from buying our products.
The growth of our business will be dependent upon the availability of adequate capital.
The growth of our business will depend on the availability of adequate capital, which in turn will depend in large part on cash flow generated by our business and the availability of equity and debt financing. We cannot assure you that our operations will generate positive cash flow or that we will be able to obtain equity or debt financing on acceptable terms or at all. Our revolving credit facility contains provisions that restrict our ability to incur additional indebtedness or make substantial asset sales that might otherwise be used to finance our expansion. Security interests in substantially all of our assets, which may further limit our access to certain capital markets or
lending sources, secure our obligations under our revolving credit facility. Moreover, the actual availability of funds under our revolving credit facility is limited to specified percentages of our eligible inventory and accounts receivable. Accordingly, opportunities for increasing our cash on hand through sales of inventory would be partially offset by reduced availability under our revolving credit facility. As a result, we cannot assure you that we will be able to finance our current expansion plans.
We must comply with the restrictive covenants contained in our revolving credit facility.
Our credit facility requires us to comply with certain financial restrictive covenants that impose restrictions on our operations, including our ability to incur additional indebtedness, make investments of other restricted payments, sell or otherwise dispose of assets and engage in other activities. Any failure by us to comply with the restrictive covenants could result in an event of default under those borrowing arrangements, in which case the lenders could elect to declare all amounts outstanding there under to be due and payable, which could have a material adverse effect on our financial condition. As of December 31, 2010, we were in compliance with all financial restrictive
covenants.
We face intense competition, including competition from companies with significantly greater resources than ours, and if we are unable to compete effectively with these companies, our market share may decline and our business could be harmed.
The footwear and apparel industries are intensely competitive, and we expect competition to increase in the future. A number of our competitors have significantly greater financial, technological, engineering, manufacturing, marketing and distribution resources than we do, as well as greater brand awareness in the footwear market. Our ability to succeed depends on our ability to remain competitive with respect to the quality, design, price and timely delivery of products. Competition could materially adversely affect our business, financial condition, results of operations and cash flows.
We currently manufacture a portion of our products and we may not be able to do so in the future at costs that are competitive with those of competitors who source their goods.
We currently plan to retain our internal manufacturing capability in order to continue benefiting from expertise we have gained with respect to footwear manufacturing methods conducted at our manufacturing facilities. We continue to evaluate our manufacturing facilities and third-party manufacturing alternatives in order to determine the appropriate size and scope of our manufacturing facilities. There can be no assurance that the costs of products that continue to be manufactured by us can remain competitive with products sourced from third parties.
We rely on distribution centers in Logan, Ohio and Waterloo, Ontario, Canada, and if there is a natural disaster or other serious disruption at any of these facilities, we may be unable to deliver merchandise effectively to our retailers.
We rely on distribution centers located in Logan, Ohio and Waterloo, Ontario, Canada. Any natural disaster or other serious disruption at any of these facilities due to fire, tornado, flood, terrorist attack or any other cause could damage a portion of our inventory or impair our ability to use our distribution center as a docking location for merchandise. Either of these occurrences could impair our ability to adequately supply our retailers and harm our operating results.
13
We are subject to certain environmental and other regulations.
Some of our operations use substances regulated under various federal, state, local and international environmental and pollution laws, including those relating to the storage, use, discharge, disposal and labeling of, and human exposure to, hazardous and toxic materials. Compliance with current or future environmental laws and regulations could restrict our ability to expand our facilities or require us to acquire additional expensive equipment, modify our manufacturing processes or incur other significant expenses. In addition, we could incur costs, fines and civil or criminal sanctions, third-party property damage or personal injury claims or could be required to incur substantial
investigation or remediation costs, if we were to violate or become liable under any environmental laws. Liability under environmental laws can be joint and several and without regard to comparative fault. There can be no assurance that violations of environmental laws or regulations have not occurred in the past and will not occur in the future as a result of our inability to obtain permits, human error, equipment failure or other causes, and any such violations could harm our business, financial condition, results of operations and cash flows.
If our efforts to establish and protect our trademarks, patents and other intellectual property are unsuccessful, the value of our brands could suffer.
We regard certain of our footwear designs as proprietary and rely on patents to protect those designs. We believe that the ownership of patents is a significant factor in our business. Existing intellectual property laws afford only limited protection of our proprietary rights, and it may be possible for unauthorized third parties to copy certain of our footwear designs or to reverse engineer or otherwise obtain and use information that we regard as proprietary. If our patents are found to be invalid, however, to the extent they have served, or would in the future serve, as a barrier to entry to our competitors, such invalidity could have a material adverse effect on our business, financial
condition, results of operations and cash flows.
We own U.S. registrations for a number of our trademarks, trade names and designs, including such marks as Rocky, Georgia Boot, Durango and Lehigh. Additional trademarks, trade names and designs are the subject of pending federal applications for registration. We also use and have common law rights in certain trademarks. Over time, we have increased distribution of our goods in several foreign countries. Accordingly, we have applied for trademark registrations in a number of these countries. We intend to enforce our trademarks and trade names against unauthorized use by third parties.
Our success depends on our ability to forecast sales.
Our investments in infrastructure and product inventory are based on sales forecasts and are necessarily made in advance of actual sales. The markets in which we do business are highly competitive, and our business is affected by a variety of factors, including brand awareness, changing consumer preferences, product innovations, susceptibility to fashion trends, retail market conditions, weather conditions and economic and other factors. One of our principal challenges is to improve our ability to predict these factors, in order to enable us to better match production with demand. In addition, our growth over the years has created the need to increase the investment in infrastructure
and product inventory and to enhance our systems. To the extent sales forecasts are not achieved, costs associated with the infrastructure and carrying costs of product inventory would represent a higher percentage of revenue, which would adversely affect our business, financial condition, results of operations and cash flows.
14
Risks Related to Our Industry
Because the footwear market is sensitive to decreased consumer spending and slow economic cycles, if general economic conditions deteriorate, many of our customers may significantly reduce their purchases from us or may not be able to pay for our products in a timely manner.
The footwear industry has been subject to cyclical variation and decline in performance when consumer spending decreases or softness appears in the retail market. Many factors affect the level of consumer spending in the footwear industry, including:
|
•
|
general business conditions;
|
|
•
|
interest rates;
|
|
•
|
the availability of consumer credit;
|
|
•
|
weather;
|
|
•
|
increases in prices of nondiscretionary goods;
|
|
•
|
taxation; and
|
|
•
|
consumer confidence in future economic conditions.
|
Consumer purchases of discretionary items, including our products, may decline during recessionary periods and also may decline at other times when disposable income is lower. A downturn in regional economies where we sell products also reduces sales.
The continued shift in the marketplace from traditional independent retailers to large discount mass merchandisers may result in decreased margins.
A continued shift in the marketplace from traditional independent retailers to large discount mass merchandisers has increased the pressure on many footwear manufacturers to sell products to these mass merchandisers at less favorable margins. Because of competition from large discount mass merchandisers, a number of our small retailing customers have gone out of business, and in the future more of these customers may go out of business, which could have a material adverse effect on our business, financial condition, results of operations and cash flows.
|
ITEM 1B.
|
UNRESOLVED STAFF COMMENTS.
|
None.
|
ITEM 2.
|
PROPERTIES.
|
We own, subject to a mortgage, our 25,000 square foot executive offices that are located in Nelsonville, Ohio which are utilized by all segments. We also own, subject to a mortgage, our 192,000 square foot finished goods distribution facility in Logan, Ohio which is utilized by our wholesale and retail segments. We own outright our 41,000 square foot outlet store and a 5,500 square foot executive office building located in Nelsonville, Ohio, a portion of which is utilized by our retail segment. We lease two manufacturing facilities in Puerto Rico consisting of 44,978 square feet and 39,581 square feet which are utilized by the wholesale and military segments. These leases expire in
2019. In the Dominican Republic, we lease an 81,872 square foot manufacturing facility under a lease expiring in 2014 and lease three additional stand-alone buildings of 24,053 square feet, 39,815 square feet and 28,929 square feet under leases which expire in 2013, 2014 and 2015, respectively. In Waterloo, Ontario, we lease a 30,300 square foot distribution facility under a lease expiring in 2012 which is utilized by our wholesale segment.
15
|
ITEM 3.
|
LEGAL PROCEEDINGS.
|
We are, from time to time, a party to litigation which arises in the normal course of our business. Although the ultimate resolution of pending proceedings cannot be determined, in the opinion of management, the resolution of these proceedings in the aggregate will not have a material adverse effect on our financial position, results of operations, or liquidity.
|
ITEM 4.
|
RESERVED.
|
Not applicable.
PART II
|
ITEM 5.
|
MARKET FOR REGISTRANT'S COMMON EQUITY, RELATED STOCKHOLDER MATTERS AND ISSUER PURCHASES OF EQUITY SECURITIES.
|
Market Information
Our common stock trades on the NASDAQ National Market under the symbol “RCKY.” The following table sets forth the range of high and low sales prices for our common stock for the periods indicated, as reported by the NASDAQ National Market:
|
Quarter Ended
|
High
|
Low
|
||||||
|
March 31, 2009
|
$ | 4.96 | $ | 2.71 | ||||
|
June 30, 2009
|
$ | 4.32 | $ | 3.23 | ||||
|
September 30, 2009
|
$ | 6.40 | $ | 3.66 | ||||
|
December 31, 2009
|
$ | 9.65 | $ | 5.55 | ||||
|
March 31, 2010
|
$ | 9.97 | $ | 7.16 | ||||
|
June 30, 2010
|
$ | 10.66 | $ | 6.15 | ||||
|
September 30, 2010
|
$ | 8.45 | $ | 5.68 | ||||
|
December 31, 2010
|
$ | 10.44 | $ | 7.25 | ||||
On February 22, 2011, the last reported sales price of our common stock on the NASDAQ National Market was $13.85 per share. As of February 22, 2011, there were 94 shareholders of record of our common stock.
We presently intend to retain our earnings to finance the growth and development of our business and do not anticipate paying any cash dividends in the foreseeable future. Future dividend policy will depend upon our earnings and financial condition, our need for funds and other factors. Presently, our credit facility restricts the payment of dividends on our common stock. At December 31, 2010, we had no retained earnings available for distribution.
16
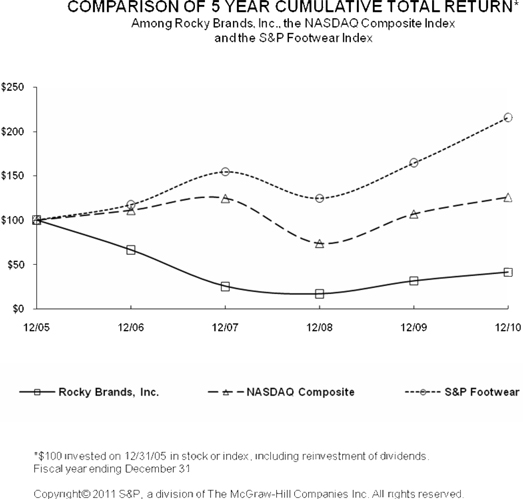
Performance Graph
The following performance graph compares our performance of the Company with the NASDAQ Stock Market (U.S.) Index and the Standard & Poor’s Footwear Index, which is a published industry index. The comparison of the cumulative total return to shareholders for each of the periods assumes that $100 was invested on December 31, 2005, in our common stock, and in the NASDAQ Stock Market (U.S.) Index and the Standard & Poor’s Footwear Index and that all dividends were reinvested.
17
|
ITEM 6.
|
SELECTED CONSOLIDATED FINANCIAL DATA.
|
ROCKY BRANDS, INC. AND SUBSIDIARIES
SELECTED CONSOLIDATED FINANCIAL DATA
(in thousands, except for per share data)
|
Five Year Financial Summary
|
||||||||||||||||||||
|
12/31/10
|
12/31/09
|
12/31/08
|
12/31/07
|
12/31/06
|
||||||||||||||||
|
Income Statement Data
|
||||||||||||||||||||
|
Net sales
|
$ | 252,792 | $ | 229,486 | $ | 259,538 | $ | 275,267 | $ | 263,491 | ||||||||||
|
Gross margin (% of sales)
|
35.4 | % | 36.8 | % | 39.4 | % | 39.2 | % | 41.5 | % | ||||||||||
|
Net income (loss)
|
$ | 7,684 | $ | 1,175 | $ | 1,167 | $ | (23,105 | ) | $ | 4,819 | |||||||||
|
Per Share
|
||||||||||||||||||||
|
Net (loss) income
|
||||||||||||||||||||
|
Basic
|
$ | 1.14 | $ | 0.21 | $ | 0.21 | $ | (4.22 | ) | $ | 0.89 | |||||||||
|
Diluted
|
$ | 1.14 | $ | 0.21 | $ | 0.21 | $ | (4.22 | ) | $ | 0.86 | |||||||||
|
Weighted average number of common shares outstanding
|
||||||||||||||||||||
|
Basic
|
6,748 | 5,551 | 5,509 | 5,476 | 5,392 | |||||||||||||||
|
Diluted
|
6,764 | 5,551 | 5,513 | 5,476 | 5,578 | |||||||||||||||
|
Balance Sheet Data
|
||||||||||||||||||||
|
Inventories
|
$ | 58,853 | $ | 55,420 | $ | 70,302 | $ | 75,404 | $ | 77,949 | ||||||||||
|
Total assets
|
$ | 168,579 | $ | 163,390 | $ | 196,862 | $ | 216,724 | $ | 246,356 | ||||||||||
|
Working capital
|
$ | 98,156 | $ | 94,324 | $ | 124,586 | $ | 135,318 | $ | 135,569 | ||||||||||
|
Long-term debt, less current maturities
|
$ | 34,608 | $ | 55,080 | $ | 87,259 | $ | 103,220 | $ | 103,203 | ||||||||||
|
Stockholders' equity
|
$ | 105,004 | $ | 82,478 | $ | 80,950 | $ | 81,725 | $ | 104,128 | ||||||||||
The 2009 financial data reflects restructuring charges of $0.5 million, net of tax benefits. The 2008, 2007 and 2006 financial data reflects non-cash intangible impairment charges of $3.0 million, $23.5 million and $0.5 million, net of tax benefits, respectively.
|
ITEM 7.
|
MANAGEMENT'S DISCUSSION AND ANALYSIS OF FINANCIAL CONDITION AND RESULTS OF OPERATIONS.
|
This Management’s Discussion and Analysis of Financial Condition and Result of Operations (“MD&A”) describes the matters that we consider to be important to understanding the results of our operations for each of the three years in the period ended December 31, 2010, and our capital resources and liquidity as of December 31, 2010 and 2009. Use of the terms “Rocky,” the “Company,” “we,” “us” and “our” in this discussion refer to Rocky Brands, Inc. and its subsidiaries. Our fiscal year begins on January 1 and ends on December 31. We analyze the results of our operations for the last three years, including
the trends in the overall business followed by a discussion of our cash flows and liquidity, our credit facility, and contractual commitments. We then provide a review of the critical accounting judgments and estimates that we have made that we believe are most important to an understanding of our MD&A and our consolidated financial statements. We conclude our MD&A with information on recent accounting pronouncements which we adopted during the year, as well as those not yet adopted that are expected to have an impact on our financial accounting practices.
The following discussion should be read in conjunction with the “Selected Consolidated Financial Data” and our consolidated financial statements and the notes thereto, all included elsewhere herein. The forward-looking statements in this section and other parts of this document involve risks and uncertainties including statements regarding our plans, objectives, goals, strategies, and financial performance. Our actual results could differ materially from the results anticipated in these forward-looking statements as a result of factors set forth under the caption “Safe Harbor Statement under the Private Securities Litigation Reform Act of 1995” below. The
Private Securities Litigation Reform Act of 1995 provides a “safe harbor” for forward-looking statements made by or on behalf of the Company.
18
EXECUTIVE OVERVIEW
We are a leading designer, manufacturer and marketer of premium quality footwear and apparel marketed under a portfolio of well recognized brand names including Rocky, Georgia Boot, Durango, Lehigh, and the licensed brands Mossy Oak and Michelin.
Our products are distributed through three distinct business segments: wholesale, retail and military. In our wholesale business, we distribute our products through a wide range of distribution channels representing over ten-thousand retail store locations in the U.S. and Canada. Our wholesale channels vary by product line and include sporting goods stores, outdoor retailers, independent shoe retailers, hardware stores, catalogs, mass merchants, uniform stores, farm store chains, specialty safety stores and other specialty retailers. Our retail business includes direct sales of our products to consumers through our Lehigh mobile stores and our websites. We also sell footwear under the
Rocky label to the U.S. military.
Our growth strategy is founded substantially on the expansion of our brands into new footwear and apparel markets. New products that we introduce may not be successful with consumers or one or more of our brands may fall out of favor with consumers. If we are unable to anticipate, identify or react appropriately to changes in consumer preferences, we may not grow as fast as we plan to grow or our sales may decline, and our brand image and operating performance may suffer.
Furthermore, achieving market acceptance for new products will likely require us to exert substantial product development and marketing efforts, which could result in a material increase in our selling, general and administrative, or SG&A, expenses, and there can be no assurance that we will have the resources necessary to undertake such efforts. Material increases in our SG&A expenses could adversely impact our results of operations and cash flows.
We may also encounter difficulties in producing new products that we did not anticipate during the development stage. Our development schedules for new products are difficult to predict and are subject to change as a result of shifting priorities in response to consumer preferences and competing products. If we are not able to efficiently manufacture newly-developed products in quantities sufficient to support retail distribution, we may not be able to recoup our investment in the development of new products. Failure to gain market acceptance for new products that we introduce could impede our growth, reduce our profits, adversely affect the image of our brands, erode our competitive
position and result in long term harm to our business.
FINANCIAL SUMMARY
|
Ÿ
|
Net sales of the wholesale segment increased $14.0 million in 2010 over prior year primarily as a result of increased sales in our work footwear category.
|
|
Ÿ
|
Net sales of the retail segment decreased $2.5 million in 2010 from the prior year primarily as a result of our ongoing transition to more internet driven transactions and the decision to remove a portion of our Lehigh mobile stores from operations and closing 22 mini-stores. These changes resulted in reductions in both net sales and SG&A expenses.
|
|
Ÿ
|
Net sales of the military segment increased $11.8 million in 2010 over the prior year as we continued to ship under the $29.0 million contract issued in July 2009.
|
|
Ÿ
|
Gross margin of the wholesale segment increased $4.9 million in 2010 over the prior year as a result of higher sales.
|
|
Ÿ
|
Gross margin of the retail segment decreased $1.6 million in 2010 from the prior year as a result of lower overall sales.
|
|
Ÿ
|
Gross Margin of the military segment increased $1.6 million in 2010 over the prior year due primarily to higher sales in 2010.
|
|
Ÿ
|
Operating expenses decreased $3.5 million in 2010 from prior year primarily as result of restructuring initiatives implemented in the fourth quarter of 2009 that were initiated to reduce operating expenses. These restructuring initiatives resulted in an additional $0.7 million of operating expenses in 2009.
|
19
|
Ÿ
|
Net interest expense decreased $1.0 million in 2010 from the prior year, primarily due to the repayment of higher rate debt, partially offset by the write-off of deferred financing costs in 2010.
|
|
Ÿ
|
Net income increased $6.5 million in 2010 over prior year results due primarily to higher net sales, expense reductions and lower net interest expense.
|
|
Ÿ
|
Total debt at December 31, 2010 was $35.1 million or $20.5 million lower than the prior year. Total debt minus cash and cash equivalents was $30.7 million or 21.9% of total capitalization at December 31, 2010 compared to $53.8 million or 39.0% of total capitalization at year-end 2009. The reduction in debt from the prior year was due primarily to an equity offering in the second quarter of 2010 and from cash generated from operations.
|
|
Ÿ
|
Our cash provided by operating activities decreased $21.9 million in 2010 from the prior year, primarily the result of the 2009 cash provided from operations being abnormally high due to usually high inventory and receivable levels at the end of 2008.
|
Net sales. Net sales and related cost of goods sold are recognized at the time products are shipped to the customer and title transfers. Net sales are recorded net of estimated sales discounts and returns based upon specific customer agreements and historical trends.
Cost of goods sold. Our cost of goods sold represents our costs to manufacture products in our own facilities, including raw materials costs and all overhead expenses related to production, as well as the cost to purchase finished products from our third-party manufacturers. Cost of goods sold also includes the cost to transport these products to our distribution centers.
SG&A expenses. Our SG&A expenses consist primarily of selling, marketing, wages and related payroll and employee benefit costs, travel and insurance expenses, depreciation, amortization, professional fees, facility expenses, bank charges, and warehouse and outbound freight expenses.
Percentage of Net Sales
The following table sets forth consolidated statements of operations data as percentages of total net sales:
|
Years Ended December 31,
|
||||||||||||
|
2010
|
2009
|
2008
|
||||||||||
|
Net sales
|
100.0 | % | 100.0 | % | 100.0 | % | ||||||
|
Cost of goods sold
|
64.6 | % | 63.2 | % | 60.6 | % | ||||||
|
Gross margin
|
35.4 | % | 36.8 | % | 39.4 | % | ||||||
|
SG&A expense
|
28.6 | % | 32.7 | % | 33.7 | % | ||||||
|
Restructuring charges
|
0.0 | % | 0.3 | % | 0.0 | % | ||||||
|
Non-cash intangible impairment charges
|
0.0 | % | 0.0 | % | 1.9 | % | ||||||
|
Income (loss) from operations
|
6.8 | % | 3.8 | % | 3.8 | % | ||||||
Results of Operations
Year Ended December 31, 2010 Compared to Year Ended December 31, 2009
Net sales. Net sales increased 10.2% to $252.8 million for 2010 compared to $229.5 million the prior year. Wholesale sales increased $14.0 million to $188.3 million for 2010 compared to $174.3 million for 2009. The increase in wholesale sales was the result of a $12.3 million or 15.6% increase in our work footwear category, a $2.3 million or 11.7% increase in our duty footwear category, and a $1.2 million or 4.0% increase in our western footwear category, which was partially offset by a $0.7 million or 5.6% decrease in our apparel category, a $0.6 million or 2.4% decrease in our outdoor footwear category and a $0.5 million
decrease in other. Retail sales were $47.5 million in 2010 compared to $50.0 million for 2009. The $2.5 million decrease in retail sales resulted from our ongoing transition to more internet driven transactions and the decision to remove a portion of our Lehigh mobile stores from operations to help lower operating expenses. Military segment sales, which occur from time to time, were $17.0 million for 2010 compared to $5.2 million in 2009. Shipments in 2010 were primarily under the $29.0 million contract issued in July 2009. Shipments in 2009 were under the $6.4 million contract issued in July 2007 and the July 2009 contract. Average list prices for our footwear, apparel and accessories were similar in 2010 compared to 2009.
20
Gross margin. Gross margin increased to $89.4 million or 35.4% of net sales for 2010 compared to $84.6 million or 36.8% of net sales for the prior year. Wholesale gross margin for 2010 was $65.5 million, or 34.8% of net sales, compared to $60.6 million, or 34.8% of net sales in 2009. Retail gross margin for 2010 was $21.8 million, or 45.9% of net sales, compared to $23.4 million, or 46.9% of net sales, in 2009. The 100 basis point decrease reflected reduced sales via our mobile stores, which carry the highest gross margin in our retail business. Military gross margin in 2010 was $2.1 million, or 12.4% of
net sales, compared to $0.6 million, or 10.7% of net sales in 2009. The shipments in 2010 under the $29.0 million contract had a higher gross margin than shipments under previous contracts.
SG&A expenses. SG&A expenses were $72.3 million, or 28.6% of net sales in 2010 compared to $75.1 million, or 32.7% of net sales for 2009. The net change primarily resulted from decreases in compensation and benefits expenses of $2.5 million, bad debt expenses of $1.0 million, Lehigh store expenses of $1.0 million and a $0.5 million decrease in the amortization of finite-lived intangible assets, partially offset by increases in incentive accruals of $2.3 million. The reductions in compensation, benefits and store expenses were partially a result of the restructuring initiatives that were implemented in the fourth quarter
of 2009.
Restructuring charges. The restructuring initiatives implemented in the fourth quarter of 2009 were completed during 2010. No additional restructuring charges were recorded during 2010.
Non-cash intangible impairment charges. Our 2010 and 2009 evaluation of indefinite lived intangible assets indicated that none of these assets were impaired.
Interest expense. Interest expense was $6.5 million in 2010, compared to $7.5 million for the prior year. The decrease of $1.0 million resulted from a reduction in average borrowings compared to the same period last year and the repayment of higher rate debt during 2010, partially offset by the write off of fees of $2.1 million associated with the early repayment of a portion of the company’s term and revolving loans.
Income taxes. Income tax expense was $3.6 million in 2010, compared to an income tax expense of $0.7 million for the same period a year ago. The increase in income tax expense for 2010 was due to the $9.4 million increase in pretax income, partially offset by a decrease in the effective tax rate. The effective tax rate for 2010 was 31.7% compared to 36.5% for 2009. The decrease in our effective tax rate for 2010 was due principally to making a permanent capital investment in our operations in the Dominican Republic, which reduced the amount of dividends that we need to provide for U.S income taxes.
Year Ended December 31, 2009 Compared to Year Ended December 31, 2008
Net sales. Net sales decreased 11.6% to $229.5 million for 2009 compared to $259.5 million the prior year. Wholesale sales decreased $13.1 million to $174.3 million for 2009 compared to $187.3 million for 2008. The $13.1 million decrease in wholesale sales was the result of decreased sales in the majority of our footwear categories and apparel. Retail sales were $50.0 million in 2009 compared to $65.8 million for 2008. The $15.8 million decrease in retail sales resulted from plant closings and layoffs in the manufacturing sector as the current economic conditions have impacted a significant portion of our
retail customer base. In addition, retail sales were negatively impacted by our ongoing transition to more internet driven transactions and the decision to remove a portion of our Lehigh mobile stores from operations to help lower costs. Military segment sales, which occur from time to time, were $5.2 million for 2009 compared to $6.4 million in 2008. Shipments in 2009 were under the $6.4 million contract issued in July 2007 and the $29.0 million contract, issued in July 2009. Average list prices for our footwear, apparel and accessories were similar in 2009 compared to 2008.
Gross margin. Gross margin decreased to $84.6 million or 36.8% of net sales for 2009 compared to $102.2 million or 39.4% of net sales for the prior year. Wholesale gross margin for 2009 was $60.6 million, or 34.8% of net sales, compared to $68.5 million, or 36.6% of net sales in 2008. The 180 basis point decrease was the result of additional sales of closeouts at reduced gross margins, an increase in manufacturing costs, and a decrease in sales price per unit for competitive reasons. Retail gross margin for 2009 was $23.4 million, or 46.9% of net sales, compared to $33.2 million, or 50.4% of net sales, in
2008. The 350 basis point decrease reflected reduced sales via our mobile stores, which carry the highest gross margin and lowest operating margin in our retail business. Military gross margin in 2009 was $0.6 million, or 10.7% of net sales, compared to $0.6 million, or 9.1% of net sales in 2008.
21
SG&A expenses. SG&A expenses were $75.1 million, or 32.7% of net sales in 2009 compared to $87.5 million, or 33.7% of net sales for 2008. The net change primarily resulted from decreases in compensation and benefits expenses of $5.2 million, shipping expenses of $1.8 million, advertising expenses of $1.5 million, Lehigh mobile store expenses of $1.1 million, travel expenses of $0.7, telephone expense of $0.4 million and show expenses of $0.4 million.
Restructuring charges. As a result of our decision during the fourth quarter of 2009 to initiate a comprehensive series of actions to reduce the operating cost structure and, increase the operating efficiency of both our wholesale and retail divisions we recognized $0.7 million of restructuring charges. These actions involved the relocation of our wholesale division’s customer care function from Franklin, Tennessee to Nelsonville, Ohio, and the closing of underperforming mini-stores in our retail division. These charges were composed of severance and employee benefits related costs; transition costs; and facility exit
costs, which includes facility shut down and lease contract termination costs.
Non-cash intangible impairment charges. Our 2009 evaluation of indefinite lived intangible assets indicated that none of these assets were impaired. As a result of our annual evaluation of intangible assets, in 2008 we recognized impairment losses on the carrying values of the Lehigh and Gates trademarks of $4.0 million and $0.9 million, respectively. We recognized tax benefits relating to the Lehigh and Gates trademark impairments of $1.6 million and $0.3 million, respectively. We estimated fair value based on projections of the future cash flows for each of the trademarks. We then compared the carrying
value for each trademark to its estimated fair value. Since the fair value of the trademark was less than its carrying value, we recognized the reductions in fair value as non-cash intangible impairment charges in our 2008 operating expenses.
Interest expense. Interest expense was $7.5 million in 2009, compared to $9.3 million for the prior year. The decrease of $1.8 million resulted from a reduction in average borrowings combined with lower interest rates compared to the same period last year.
Income taxes. Income tax expense was $0.7 million in 2009, compared to an income tax benefit of $0.6 million for the same period a year ago. In 2008, we recognized a $1.9 million benefit relating to the non-cash intangible impairment charge of $4.9 million; a $0.6 million reduction in income tax expense related to the filing of the 2007 Federal income tax return; and, a $0.1 million reduction in income tax expense related to an adjustment of state deferred tax liabilities.
LIQUIDITY AND CAPITAL RESOURCES
Overview
Our principal sources of liquidity have been our income from operations and borrowings under our credit facility and other indebtedness.
Over the last several years our principal uses of cash have been for working capital and capital expenditures to support our growth. Our working capital consists primarily of trade receivables and inventory, offset by accounts payable and accrued expenses. Our working capital fluctuates throughout the year as a result of our seasonal business cycle and business expansion and is generally lowest in the months of January through March of each year and highest during the months of May through October of each year. We typically utilize our revolving credit facility to fund our seasonal working capital requirements. As a result, balances on our revolving credit facility will
fluctuate significantly throughout the year. Our working capital increased to $98.2 million at December 31, 2010, compared to $94.3 million at the end of the prior year.
Our capital expenditures relate primarily to projects relating to our corporate offices, property, merchandising fixtures, molds and equipment associated with our manufacturing operations and for information technology. Capital expenditures were $4.7 million for 2010 and $4.9 million in 2009. Capital expenditures for 2011 are anticipated to be approximately $6.0 million.
In March 2009, we amended the terms of our revolving credit facility with GMAC Commercial Finance (“GMAC”) which was set to expire on January 5, 2010. The size of the facility was reduced to $85 million from $100 million and the maturity date was extended to April 30, 2012. The interest rates for the term of this amendment were LIBOR plus 3.75% or prime plus 2.25%, at our option. The financing costs associated with this amendment totaled approximately $1.5 million.
In May 2010, the Company completed a public offering of 1.8 million shares of common stock at a price of $8.40 per share. We received net proceeds from the offering of $14.1 million after deducting $0.9 million in underwriting discounts and $0.1 million in expenses. The proceeds were used to prepay amounts due under term loans with Laminar Direct Capital L.P. and Whitebox Hedged High Yield Partners, L.P. In connection with this transaction, $0.2 million of prepayment fees and $0.2 million of non-cash charges related to deferred financing fees were incurred and have been reflected as a component of interest expense.
22